Signalling
- Archive
- Diageo Video
- Signal Box
'Signalling' Marris Steps for Balanced Growth Path
MARRIS PRINCIPLES
gd = gc
- Organic Growth
- Using Retained profits for R&D
- No acquisitions
- Diversification
- New product development
- Differentiation of existing products
- Dividends and Positive Learning Transfer
- Paying dividends to keep shareholders happy
- Building trust between shareholders and management
Step 1:
CEO SIGNAL“Our first priority is to grow the business that we currently have, so organic growth is a priority...secondarily, if we see opportunities for growth in acquisitions we will certainly seize those opportunities. In fact, I think we have a reasonable track record with that one.”
Paul Walsh, CEO, Diageo PLC
Step 2:
Key Ratios – Marris Financial Constraints
| 2002 | 2003 | 2004 | 2005 | 2006 | |
| Retention Ratio | 0.691 | -0.842 | 0.508 | 0.403 | 0.382 |
| Liquidity Ratio | 0.061 | 0.049 | 0.051 | 0.038 | 0.037 |
| Leverage Ratio | 0.271 | 0.252 | 0.230 | 0.211 | 0.241 |
- Retention ratio whereby the lower the ratio the higher the funds to pay dividends.
- The higher the rate of retained profits the greater the potential the organization has for growth.
- Liquidity ratio whereby too high a value increases probability of takeovers.
- Leverage ratio whereby the higher the ratio the more difficult it is to borrow.
Step 3:
Diageo 5 Year Share Price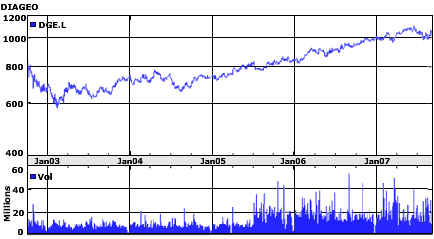
Share Price
- Share Price over 5 years showing increased value, with growth in Market Capitalisation of the firm.
- Security defence - reduces threat of takeover as per Marris.
- Share Price over 5 years showing increased value, with growth in Market Capitalisation of the firm.
- Security defence - reduces threat of takeover as per Marris.
Step 4:
Share buyback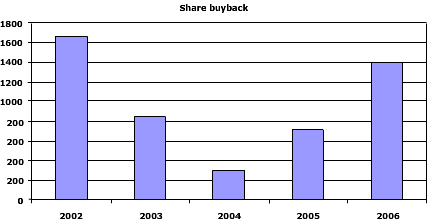
Share Buyback
- Share buyback is used as a management strategy to inflate the shareprice, thereby increasing the value of the company, in line with the Marris principles.
- This has enabled Diageo to begin a policy of acquisition (higher valuation provides better opportunities of obtaining finance for acquisition).
- Drop in share buybacks in 2004 is explained by the exceptional cost from disposal of Burgerking in 2003
Step 5:
Growth Curve
Growth Curve
- Share price - indicator of Value which is our security variable
- R&D - a proxy of gd
Step 6:
Signal Analysis- LISTEN to the video clip.
- Open the SIGNAL BOX.
- REPLAY the video clip.
- IDENTIFY the SIGNALS
| Diageo Signals |
|---|
| 1st SIGNAL = 'earnings up' +ve |
| 2nd SIGNAL = 'best profit ever' +ve |
| 3rd SIGNAL = 'guidance for coming year' +ve |
| 4th SIGNAL = 'organic profits' +ve |
| 5th SIGNAL = 'consumer spending' +ve and -ve |
| 6th SIGNAL = 'premium brands' +ve |
| 7th SIGNAL = 'marketing spend' +ve |
| 8th SIGNAL = 'exposure to US dollar' -ve |
| 9th SIGNAL = 'slow-down' -ve |
General Template
Likely Impact on the Share Price
Economic fundamentals signal
Investor signal
Probables/possibility signal
NB: KFIs such as EV, p/e, q-ratio, PSR, ROCE, are reported. The signals in this BOX are gleaned from video interviews with analysts and CEOs.
| Key Text | Signal | + Impact | - Impact |
| profit | results on upside | upside; organic profits; best profits | profit warning cash outflows declining markets |
| order book | seasonal | filled order books buffer | capacity constraints |
| earnings | earnings upside | Upside by xx% | less than market expectation |
| revenues | better than expected positive on revenues | upside | less than market expectation |
| costs | rationalise | outsource/rationalise cost savings target met | consolidate |
| demand | products brand identity holds | upside; premium brands; more consumer spending; increase in marketing spend | downturn; pedestrian; consumer numbers down; less consumer spending |
| geography | Europe v North; America v BRIC | growth in all markets; well positioned in growing markets | fall-off in sales in market X |
| dividends | surplus cash to investors | Mover; Return to shareholders | stock in 2nd row |
| change in profits | currency fluctuations | Due to FOREX less than expected; In some segments only | FOREX risk and exposure in some key markets |