- Reaction Functions and ISO-Profit Curves
- The Heart of the Competitive Process
Reaction Functions and ISO-Profit Curves
What can management learn from the discussion in the Study Guide about the nature of the competitive process? If a kinkeddemand curve did exist then it creates a barrier to the price flexibility necessary to attain the goals of management, in particular the goal of profit maximisation. Should we assume that the firms are profit maximisers? One possible reason, apart from his Neo-Classical training, is that in oligopolies that do exhibit price rigidity the firms have goals other than profit maximisation. With this we would agree. By implication, profit maximisation would appear to be a goal in industries which do not exhibit price rigidities. But this is not the case generally across managerial theories of the firm such as the Baumol firm or the Marris- Williamson firm.
Moreover, Simon and Penrose would argue that management knows its own limitations, is aware of the limited accuracy of the data and the ccomputation procedures available and is more inclined to adopt a more modest and realistic goal of satisficing. Satisficing behoves management, intent on market consolidation, to obtain information on productmarket conditions, conditions which are deemed to be viable but offer no assurance of predicting for management the best of all possible worlds. The market classifications supplements the satisficing and maximising behaviour of management. This would be reflected in the rule-of-thumb procedures regularly found cocooned away in modern business decision making. With respect to what is being maximised or satisficed, it may be some nonpecuniary variable in the firm's objective function like the reorganisation of the warehouse for more efficient distribution, a more efficient JIT distribution system, staff turnover, pollution control, product quality or indeed the establishment of a leadership position or power base in the product-market.
Whatever it is, the rigidity of prices do not influence the objectives of management. The price leader of an industry is the firm which initiates a price change and very often the dominant firm in the industry assumes the role of price leader. But in a situation where we have a monopoly it can be shown that the low-cost firm eventually becomes the price leader. But in the context of establishing a power base, any firm can become a price leader by fooling the rival firms about its price decision. The emergence of a price leader can be a complicated process. Our point of departure is a concept called the iso-profit curve. In other words, management would anticipate a rival response or indeed a response to rival behaviour contingent on a no-change in profit levels criterion. The iso-profit line, as derived, indicates the positions which allow equal profit.
Consider Figure 4 which illustrates the profits charged by competing firms with firm A on the horizontal axis and firm B on the vertical axis. We are deriving the iso-proft curves for firm A. At any point on the contour, firm A makes the same profit as at points a, b, c and d. Hence given the profit Π1, firm A is said to be indifferent to charging the prices p3, p4 or p5. The isoproft curve is analogous to the managerial indifference curve in Unit 1 and the higher these curves are from the firm’s price axis the higher the level of profit. Firm A would prefer to be at f on Π2 than c on Π1. What determines the isoprofit curve on which A decides? The answer is firm interdependence.
The Heart of the Competitive Process
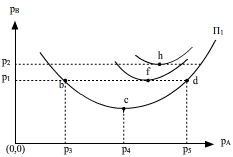
Figure 1 illustrates the mechanism of price changing that is at the heart of the competitive process. Suppose that firm B is a price leader and that B’s management sets the price p1 in Figure 1 which gives A two price responses b and d. Then firm A will realise profit Π1 by charging prices either price at b or d contingent on B charging p1. Point c which shows the same profit is not considered. B would have to set a lower price for c to be realised. How will A react to B’s price? Will firm A choose b or d? The answer is that firm A will choose neither price. There is an isoprofit curve higher than Π1 but lower than Π2 which will indicate the highest profit A can make given B’s price. In other words, for every price B charges there will be a unique profit maximisation price for A. It will be established at the lowest point on the highest attainable iso-profit curve.
For example, assume that B sets price p2 and A commences with a on Π1 - as A moves along the horizontal line projecting from p2, successively higher indifference curves are met until point f is reached on Π2 the lowest point on the highest attainable iso-profit curve. Since point c is only reached if firm B sets a lower pricethan p1 [say] p6, likewise a point like f, which could yield a higher profit for firm A is only becomes feasible if firm B were to set a price higher than p2. A smooth curve going through all the points of intersection is the reaction curve. A similar derivation will give us the reaction curve of firm B which is convex to the vertical axis. The products produced are substitutes which means that if B’s price is fixed then as A increases price B's profits should increase as firm B gains some of A customers; and similiarly for firm A if A’s price is fixed. Secondly, the curves are convex to reflect the fact that there are a range of prices over which A must lower price to meet competition and retain the level of profits.
Deriving a Reaction Function
After some point, however, if both continue to lower prices, profit of A will fall since the increase in output will cause costs to increase and thus lower profits. Thirdly, the fact that the lower points of iso-profit lines lie to the right of each other for firm A as a move is made from a lower to a higher iso-profit curve, indicates that firm A will gain some of B’s customers, by market encroachment, when B raises price. Finally, if firm B sets the price, firm A will react with a price which will put firm A on the highest iso-profit level so that firm A’s reaction curve [the locus of points c, f, h] pass through the lower points of A’s isoprofit curves. This is reflected in the tilt to the right in A’s reaction curve in Figure 4. If new firms enter the market the incumbent firms will respond - how they respond may gave the anti-trust investigator some insight into the degree of collusiveness on price and the extent of market-sharing arrangements.