- The Classic Marri...
- Balanced Growth...
- Quasi-Marris Mod...
- The Dividends Pa...
- Signals from CEOs
The Classic Marris Model
Abstracting from the literature on the Marris model, there is a consensus that Marris proposed a model of key metrics of firm performance, including sales growth and profitability. The sales growth depends on the success of R&D expenditure achieving product diversification, otherwise the company matures in a (possibly) declining market. But management are faced with an interesting trade-off: to invest more in R&D or return cash to shareholder investors. We call this the dividends paradox and it is discussed later.
We chose this model in Managerial Economics module because it represents one of the few explicit analyses of firm growth and because it has a greater relevance today than ever before as management struggle to maintain performance. The simplifying assumption of a balanced growth path allows Marris to formulate a long-run equilibrium growth model in which the firm’s rate of demand-side growth must balance its rate of supply-side growth, and in which explicit economic factors can be identified which influence both sides. The Marris model can be summarized by the equation:
The equation uniquely determines the firm’s equilibrium growth rate and the rate of return on its capital (p). Marris had represented this outcome by plotting the profit rate p versus the growth rate g. We plot the firms's 'valuation ratio' - the name given by Marris to the ratio of market value to underlying asset value, subsequently named q by Tobin) and the growth rate. It allows for an interesting trade-off: the management may pursue a faster growth rate at the price of reducing the valuation ratio to below its maximum: as shown in Kaelo. Please note that a robust empirical relationship between low valuation ratio and statistically observed probability of takeover had been identified by Bartley and Boardman in 1986.
The firm’s demand-side growth rate (gD) is determined by the extent of product development, including market activities and technological innovation activities. The functional f reflects available market opportunities and the growth of the markets entered into by the firm. The extent of product development is then related to the firm’s goal of increasing its profit rate (p). The achievement of this goal depends on the firm’s managerial capacity to successfully promote product development. According to Marris, demand-side product development efforts should eventually lower the firm’s rate of return on capital (p) if one assumes diminishing returns to product development activities. Improvement of the firm’s managerial capacity (e.g., improved information processes), also reflected in the functional f, can be expected to moderate the demand-side tradeoff between growth and profitability. The supply-side growth rate (gC) of the firm’s capital base is dependent on the extent of internal financing from profits, where the parameter α* reflects the maximum extent of new investment that can be financed per unit of profitability. The value of α* is determined by shareholders’ interests in avoiding low profits and possible takeover.
Balanced Growth Path Can Shift
When there is very little development (e.g., in newly emerging markets) in products, gD may still increase both profit and growth rates. A contrary situation might arise only after diminishing returns to development starts to become evident. If the firm’s management is bounded rational and thus is ineffective in generating a maximum growth rate, given a desired profit rate, then the balanced growth path curve can be expected to shift inward. An inward shift could also result from a general decline in market demand, or from entry and mobility barriers within the firm’s industry. Conversely, an avoidance of the Penrose effect should shift the balanced growth path outward. Thus, changes in the extent and utilisation of the firm’s managerial resources can be represented as movements along a supply-side growth locus gC = α*p = gD.
According to standard accounting principles the term p in Marris’ model is influenced by the firm’s capital (asset) turnover ratio, measured as output/capital. This ratio is an indicator of the operating effectiveness of the firm - the extent to which the firm’s asset base has been used to generate sales. Relative ineffectiveness of the firm’s sales efforts would result in a lower rate of return on capital, p, and a reduced growth rate. Furthermore, the term p is also influenced by the profit margin on sales, measured as profit/output, which can be interpreted as an indicator of the firm’s operating efficiency. Relative inefficiency of the firm’s operations (expenses increase relative to sales) would result in a lower value for p. The presence of a Penrose effect, for example, inefficient or ineffective management, though not specified as such by Marris, could result in inward shifts of the balanced growth path.
Quasi-Marris Model 21st Century
By 1970s, Mueller had advanced the Marris model by advocating a life cycle of firm growth. Mueller's life cycle was a major qualification of the classic linear characterization of the growth path of a firm advocated by Marris. Borrowing the arguments first identified by Mueller, we can also think of the Marris model as follows: first, sustainable long-run growth requires market growth; this can be achieved, at a cost, by search and research and development (R&D). In turn, new markets must be supported by new productive capacity. The combined costs of the Penrose effect, R&D and new capacity may be called the costs of growth. They require cash flow. Cash flow may be obtained from retained profits, new share issues and new debt. The amount of the last, in any given period, is constrained on the one hand by the unwillingness of lenders to offer unrestricted sums relative to the firm's existing scale, and on the other by managers' fears of the risks, to them, of excessive leverage. The financial effect of new issues is similar to that of retentions and for this reason (and also because it is in practice a small source of finance) may for simplicity be ignored. Hence for ease the problem may be posed as if the only source of finance for accelerating growth were retentions.
Suppose that the operating profit rate on existing assets from existing markets is given. By retaining cash (and thus lowering current dividends) in expectation of future growth of markets, profits and hence future dividends, management effectively throws the path of future dividends into the future; the accelerated path substitutes the prospect of higher future for lower current rewards for stockholders. Allowing for equivalence, before tax, of dividends and capital gains, such a change may, over a range, be welcomed by shareholders and tend to raise the market value of the firm on the stock market. Beyond a point, however, the effect must go the other way, as shareholders are increasingly 'stuffed' with more jam tomorrow, relatively to jam today, than they would desire.
It follows that the management can pursue a growth rate (implying specific costs of growth and profit retention ratio) that would maximize the firms's 'valuation ratio' (the name given by Marris to the ratio of market value to underlying assets, subsequently named q by Tobin). Alternatively the management may pursue a faster growth rate at the price of reducing the valuation ratio to below its maximum; this may be called an expression of 'growth-preference', paralleling Williamson's 'expense-preference'. If management have growth-preference, the model closes, with a unique management desired growth rate, and thus the factors which encourage managerial behaviour encourage faster growth of firms viz more expenditure on R&D and marketing and hence a positive learning transfer between management and investor shareholders.
The Dividends Paradox
The management does not wish to cease growing and so retains an increasing proportion of more modest profits to finance heavier growth costs. Growth slows, but does not cease, and remains faster than it would have been in the absence of effective managerial growth-preference. To sustain the market value of the company, should management pay dividends or retain more modest profits? Management can enjoy fast growth while also benefiting shareholders; their retained money is being better spent than they could invest it elsewhere. However, on account of management concern with their own security from takeover, they would be unlikely to push their activity so far as to dilute the market value of their own shares sufficiently to create reverse risk of takeover of themselves. Eventually the new markets saturate and unless others similarly profitable markets are found, the firm becomes mature and value peaks. Consider McNutt’s version of the Scouller diagram.
Signals from CEOs
Agency costs
But is it possible to extract information from share price movements? CEOs give interviews, and investors listen and try to identify a signal, unintentional or deliberate, from the text of the CEO interview that could allow an investor to predict likely actions from the company. Actions that could impact positively or negatively on the growth performance and therefore on recommendations to BUY or HOLD the stock! So there are agency costs arising between the investor shareholder and the CEO.
One way to tackle the agency costs is for management to design a trust mechanism between shareholder and management, and thus enabling shareholders to entrust money to management with a reasonable expectation of getting something back. Both recognise that there is a connection between the level of dividends paid out and the company’s growth rate. If the company uses its profits to pay dividends, it retains less money in the business. It therefore has less available to finance new investment in its products.
Positive Learning Transfer
A central theme is designing trust is the context of the management decision, that is, how the decision is observed by shareholders. Shareholders may adopt a Bayesian-type rule, seeing what they want to see about management and the firm. Management should resist this. How? They could signal a positive learning transfer to shareholders whereby management with prior experience (in games with) value-growth issues introduce positive expectations of a stronger performance (higher value for the firm).
The diagram shows that there is a trade-off between the proportion of profit paid out by the firm and how much it can grow - every time the firm reduces the dividend proportion by moving down the vertical-axis, it can finance extra growth. The key issue for shareholders is whether or not the investment being financed by paying out less in current dividends eventually produces more profits and future dividends. Shareholders have to trust management.
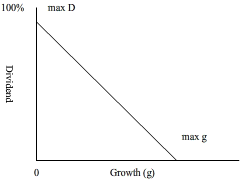
This could be achieved through persuading shareholders to view the decision as a continuum rather than as a dichotomy. In other words, the decision has to be framed as a decision about more growth and higher value and not about less value and more growth. Shareholders can then observe the decision of management as a chance wherein making a gain in circumstances where they trust management outweighs the risk of making a loss. Neither extremes in the diagram above are satisfactory - there is a point of maximised growth, g*, which can be achieved in the Marris model but there is a trade-off in terms of dividends today and the success of any new products (dividends tomorrow) that drive future growth.